6 Must Know KPI’s for Life Insurance Agents
You’ve probably heard before that being an internet life insurance agent really makes you an internet marketer.
Well, it’s true.
Having a strong digital presence is critical to driving leads, engaging customers, making sales, and ultimately receiving referral business from said sales.
Yet how do you know if all your blog posts, tweets, status updates, and emails are really making a difference?
Simple, it’s called tracking.
To track your digital marketing efforts, you’ve probably looked to Google Analytics, or if you’re a current NinjaQuoter customer, then Ninjalytics.
You’ve seen stats that show you traffic from campaigns, unique visitors, click-throughs, and more.
However, this data is nothing more than a series of numbers and rollercoaster-looking graphs if it doesn’t relate to your business goals.
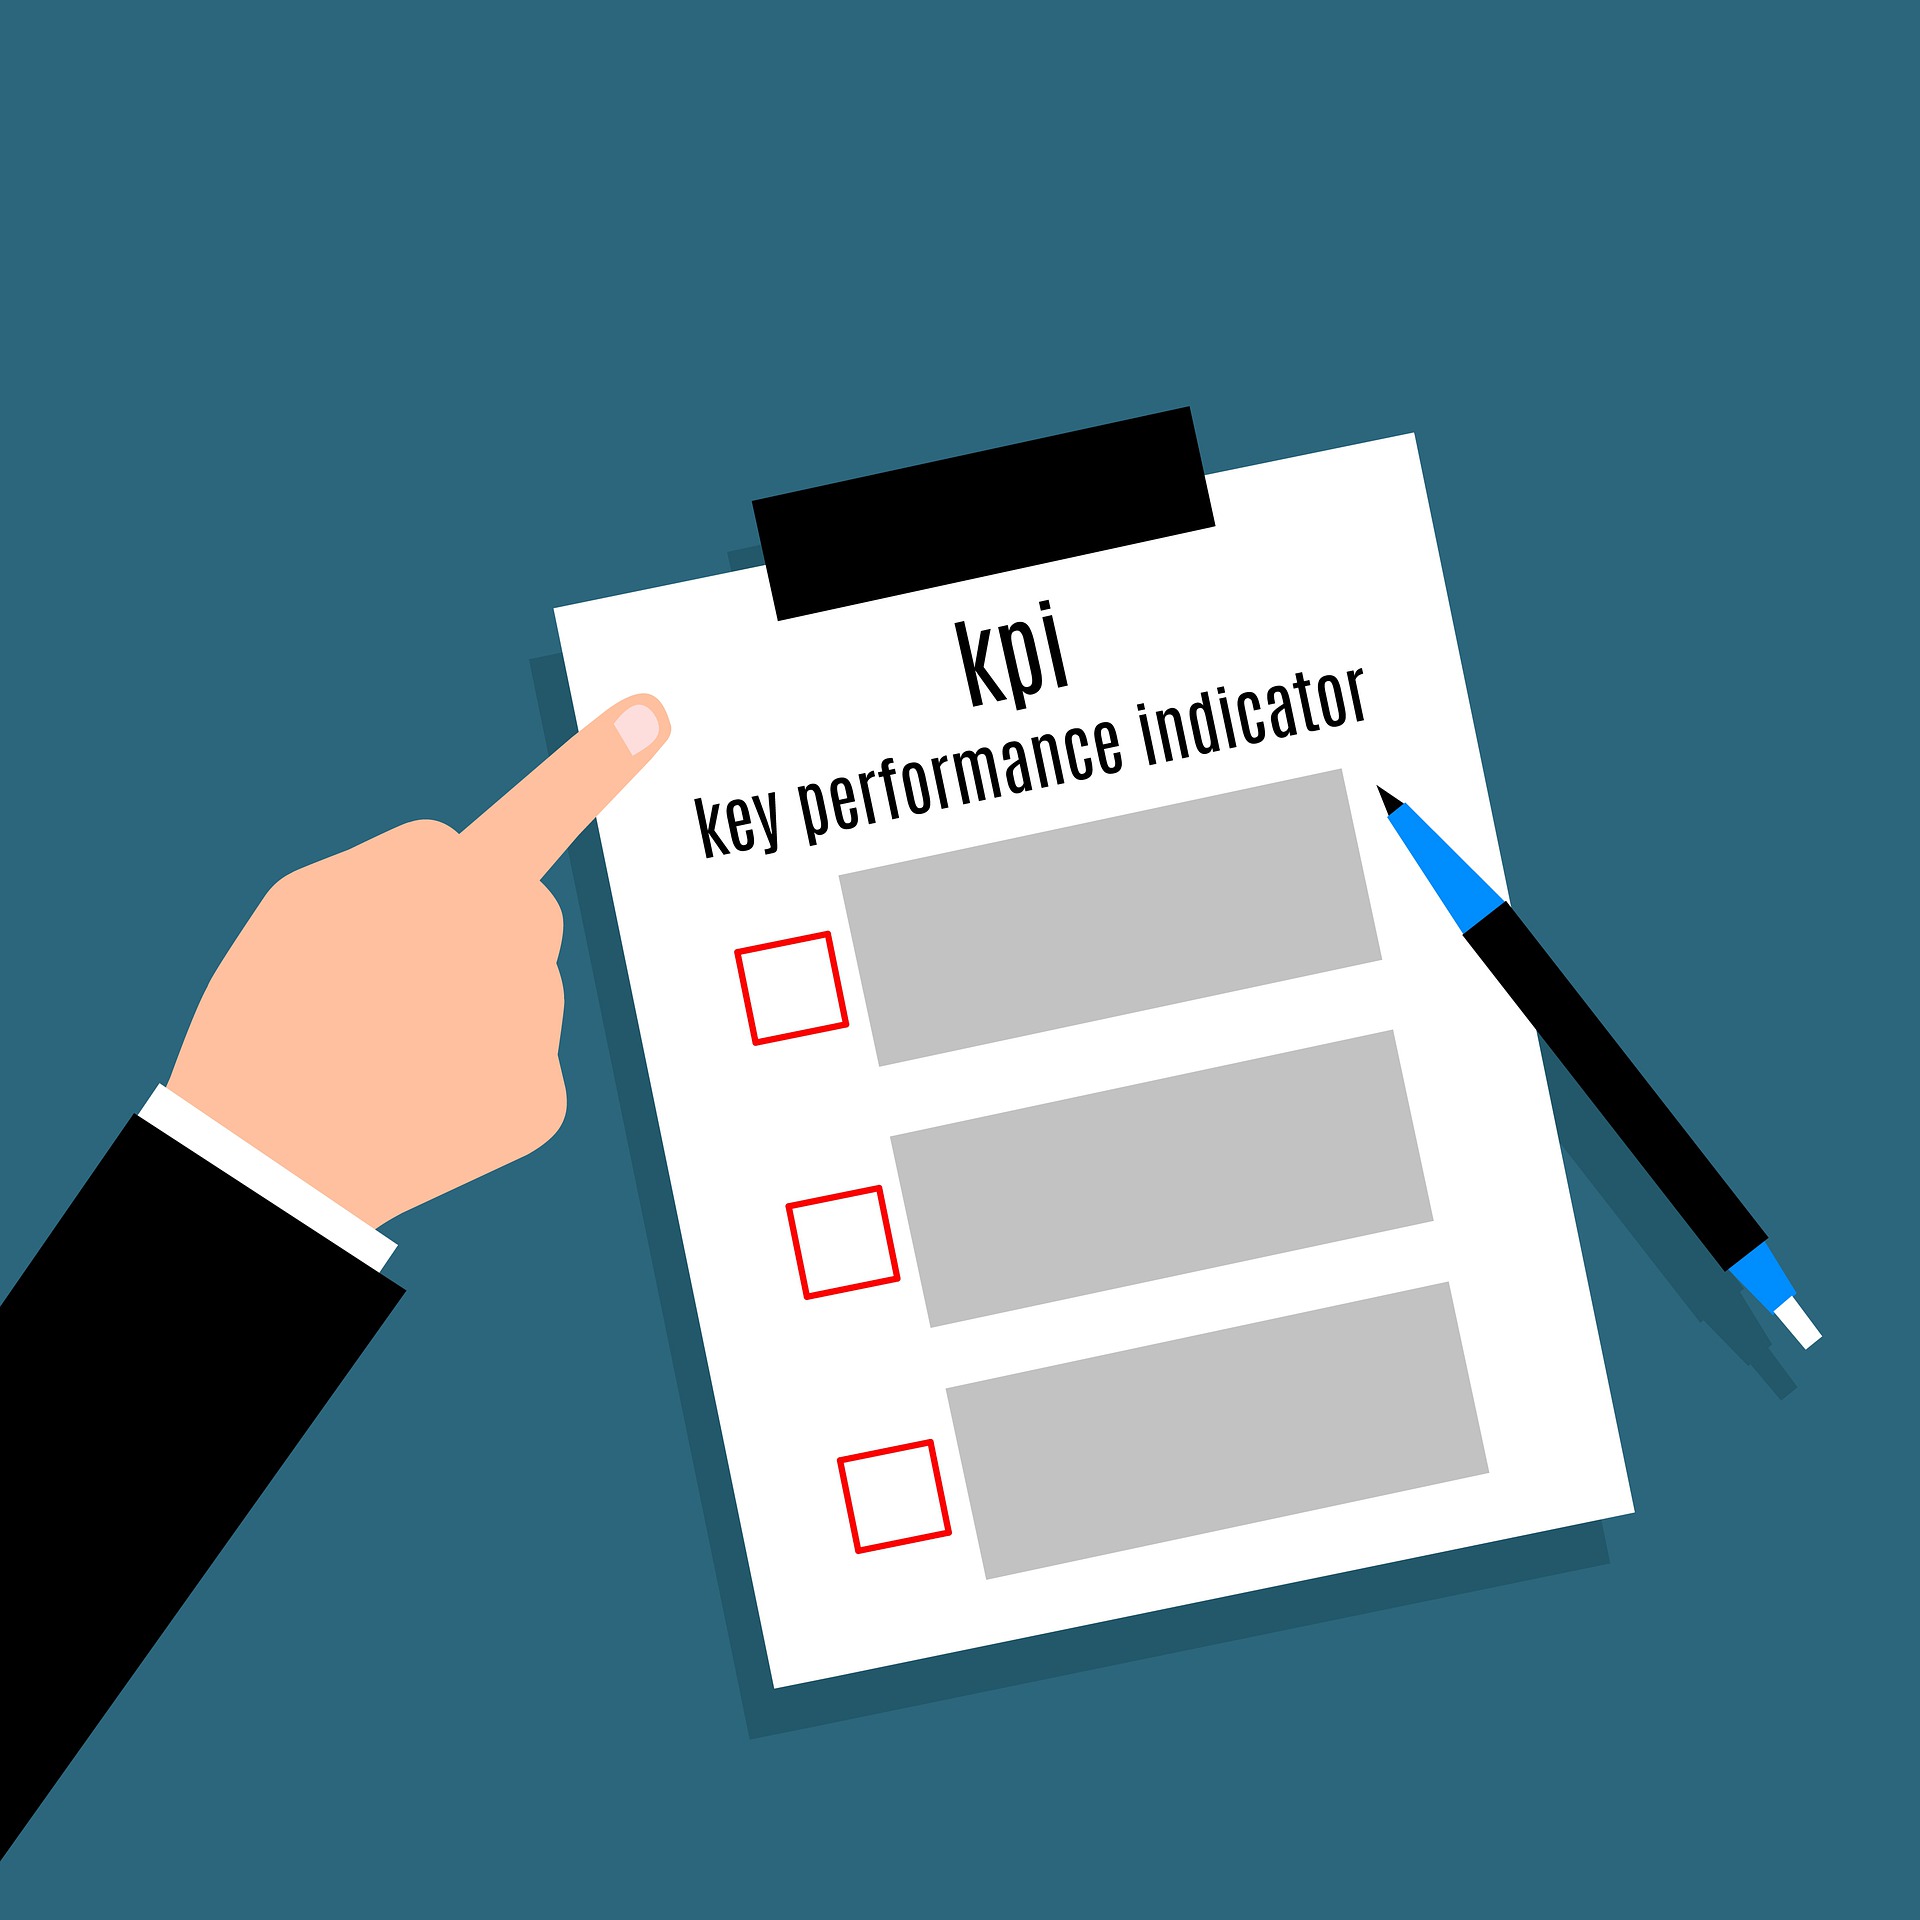
That’s where Key Performance Indicators (or KPIs) come into play.
KPIs are used by all sorts of companies to track progress toward various goals.
As long as your KPIs keep getting better and business is growing, then commissions will follow.”
He goes on to stress that “focusing on improving KPIs one at a time will make you a better business owner and a more profitable life agent.”
In other words, KPIs are your new best friend.
If you had already set up KPIs for your efforts during 2016, now would be the time to review them.
If you haven’t given much consideration to them before, well then now is really the time to dial in on your KPI strategy for 2017.
6 KPI’s For All Life Insurance Agents to Track
Now every type of business has different KPIs that make sense for them, but below are the 6 digital marketing KPIs we believe are most important to independent internet life insurance agents.
#1-Engagement on website
As an internet life insurance agent, your website is your number one salesperson (behind you of course), working around the clock to attract new leads and guide them through the sales funnel.
You should always be striving to increase the volume of traffic your site receives as well as the conversion rate of those visitors.
Metrics that you should be constantly tracking to understand how your website is performing, include:
- Number of unique visitors
- Lead registrations
- Return visits to the website
- Time spent on the website
- Popular pages and navigation paths
Track these numbers in a CRM dashboard or spreadsheet and review them every month.
You should also be setting goals, two of which we recommend are:
- 3-5 minutes – time on site of an engaged prospect
- 5-7% – conversion from site traffic to lead
For niche websites or agents who have developed a buyers persona, these numbers may be higher.
If you are not reaching these numbers, you should rethink your call-to-action (or CTA).
One suggestion is to add a site bar sticky widget so the quoter never leaves the view of the consumer when they scroll.
When experimenting with different design elements or CTAs, change one aspect at a time and let it sit for 2 weeks before changing anything else.
For instance, if you decide on a scrolling widget, do not change the headline copy or colors too.
Each change is a micro-experiment and you need enough data to make an educated decision on further changes.
*If you are a NinjaQuoter customer, you’ll have detailed Ninjalytics data leading up to the total number of leads, including
- Viewed quoter
- ran quote
- selected quote
- completed application
- quote only leads
- app leads and total leads
#2- Traffic Sources
Stay on top of where your traffic is coming from, and understand which of the four categories it falls under direct, referral, search and campaign.
Keep track of overall traffic numbers, and also the number of leads from each source.
For best practices, you’ll want to track the quality of your leads, which you can do by dividing them into two categories: good and bogus.
When you receive a lead that contains useless information and no viable way of contacting them, that’s a bogus lead.
Success indicators for traffic sources can be seen as overtime by tracking your KPIs in a spreadsheet.
- If there’s an increase in traffic for one source while the rest remain at the same level
- If you see more conversions from certain sources
Remember to give yourself at least 90 days of data before shutting down or changing your traffic strategy, oftentimes success takes time to see.
For a little traffic terminology refresher:
- Direct traffic: Visitors that visit your site by typing your URL into their browser
- Referral traffic: Visitors that visit your site by clicking on a link in another website.
- Organic traffic: Visitors that discover your website by searching relevant keywords in Google, Yahoo or Bing and then click on your listing.
- Campaign traffic: Visitors that visit your website through a dedicated paid campaign, which could be PPC on Google, Yahoo, and Bing or display ads through media buying and ad networks.
#3-Marketing Activity
Keep track of your digital marketing efforts to know if you’re spending your time correctly and providing the right type of value to your customers.
At a minimum, you should be engaging in content marketing and SEO, although you may also be posting on social media, creating videos, and running ads on Facebook.
For content marketing, we recommend you track the following KPIs:
- Unique visits: tracking UVs gives you a good baseline for how different types of content perform over time
- Geography: allows you to know where your content is being read, so you can allocate your budget accordingly.
- Mobile readership: understanding how people are reading your content will help you make decisions for responsive design.
- Bounce rates/time spent: Track how much time people are spending on your content pages, like blog posts to see if your content strategy is working.
- Comments: Are your posts getting comments from potential clients asking for more information about your post topic? Many agents will have readers ask specific questions about their medical situations on a blog post, so take the option to comment seriously and be quick to respond.
For SEO, you should be tracking the number of quality links pointing to your site and content.
A strong link building strategy not only increases traffic to your site, but it helps build industry relationships and helps to build your online brand.
If you’re unfamiliar with link building or need a refresher (let’s face it, it’s a complicated topic), we suggest checking out Moz’s Beginner’s Guide to Link Building.
#4-Landing page conversions
The primary goal of any landing page is to generate leads, either through an instant quote or an opt-in registration form.
Tracking your landing page conversions is a critical KPI so that you can know if your content is resonating with your visitors and if your design elements and CTA are converting.
To know how your landing pages are performing, track the number of unique visitors to your landing page and the number of people who complete your sign up goal (i.e. run a quote).
We suggest you should be hitting a conversion rate of 30-35% on your targeted landing pages.
If you’re below this rate then you need to start making adjustments.
One great way to do that is with A/B testing, which you can read about more on the Ninja Quoter blog.
Pay attention to how your CTAs, images, and copy relates to your chosen niche and to life insurance in general.
Don’t be too broad by just saying “Get Quotes,” make sure your visitors know they’re in the right place.
Learn landing page best practices from the experts at Unbounce who scrutinized six different insurance examples.
Although they’re not all life insurance, the strengths and weaknesses they found with each can be applied to your landing pages.
#5-Mobile traffic
It’s no surprise that more and more leads are coming from mobile from these days.
Especially for internet agents who engage in content marketing, are on social media and have strong word-of-mouth marketing, traffic from mobile will only continue to increase.
In fact, one NinjaQuoter customer reported that mobile accounted for 52% of all traffic to their landing pages, this is quite a bit higher than many other industries.
First things first when tracking your mobile KPIs is to get a good idea of your current mobile presence.
Are your landing pages optimized for mobile?
Can people easily click on your CTA using a small screen and their fingers?
Is your site easy to navigate from a cell phone or tablet?
Can people easily click on your phone number or contact buttons?
These are all aspects to consider when designing your digital experience.
To track your mobile KPIs, we suggest the following metrics:
- Number of lead conversions from mobile devices
- Bounce rates from mobile devices
- Conversions for each landing page from mobile devices
Whatever you do and wherever you currently are in mobile, do not underestimate the power of it to drive qualified leads and generate sales.
Online campaigns
Paying for traffic online is a great way to drive consistent numbers to your landing pages.
However, since you’ll be paying money out of pocket to run campaigns, you need to track results very closely to make sure your advertising efforts are working.
For life insurance who already are using paid strategies and those who are considering it, some common types include:
- Pay-Per-Click Advertising
- Display Advertising
- Facebook Advertising
- Insurance Ad Networks
- Affiliate and Affinity Marketing
The best way to measure their effectiveness is to calculate Cost Per Lead:
(Total Spent on Campaign) / (Total Number of Leads)
You should know the average value of a lead and whether or not this ratio is a good deal.
Give campaigns 30 days before changing them as these things do take time, but shut them down if you find they’re costing you more money then they’re bringing in.
And Finally…
As you track your digital marketing KPIs, make sure you’re aware of your total marketing costs (lead costs + money spent on marketing) and cross-reference it with your sales data.
At the end of the day, digital marketing should be bringing in more money.
As you begin reviewing your KPIs month after month and noticing trends, ramp up your efforts on strategies that are showing growth and shut down any that aren’t benefiting you at all.
If something shows very small growth, then test different elements to see if your numbers improve over an additional 30 days.
Remember, digital marketing is a marathon, not a sprint, and your tactics will always be evolving and improving.
Keep yourself educated on new trends and tools by following Ninja Quoter on social media.